


Introduction
Bitcoin is once again approaching a critical decision point as price action grinds higher into a well-defined resistance zone. While structural and on-chain indicators continue to suggest a constructive medium-term backdrop, the market is now testing an area where profit-taking has historically emerged. As a result, Bitcoin appears positioned for either a decisive breakout that could ignite a broader bullish phase or a corrective pullback designed to reset momentum.
Spot supply on exchanges continues to decline, signaling reduced immediate selling pressure. However, from a technical perspective, Bitcoin is pressing directly into a heavy resistance pocket. Therefore, traders and investors alike are watching closely to see whether buyers can absorb overhead supply or if sellers will force a temporary retracement.
Bitcoin Price Analysis: The Daily Chart
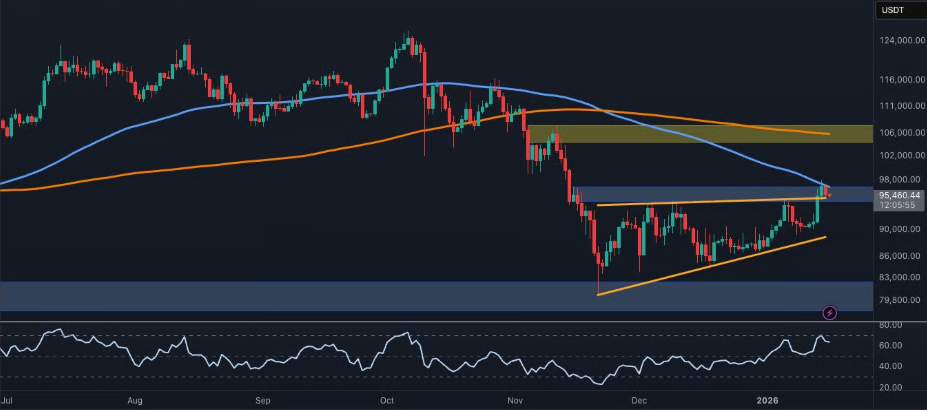
On the daily timeframe, Bitcoin has pushed back into the $95,000 resistance zone, an area that aligns closely with the 100-day moving average. This zone has repeatedly acted as a supply area during prior rallies, making it a technically significant level within the broader market structure.
Previous attempts to reclaim this region were met with rejection, reinforcing its importance. As long as Bitcoin remains below the 100-day moving average, the current advance should be treated cautiously. From a structural standpoint, this move still fits within a broader corrective phase rather than a confirmed trend reversal.
The Relative Strength Index (RSI) on the daily chart is elevated, reflecting strong short-term momentum. However, it is no longer at extreme levels, which suggests that buying pressure remains present but is beginning to normalize. This positioning allows room for either continuation or consolidation without immediately signaling exhaustion.
If Bitcoin can break and hold above the $95,000 resistance band, the next major upside target would be the $106,000 region, where the 200-day moving average is located. A successful reclaim of that level would likely mark the beginning of a more sustained bullish phase. Conversely, failure at resistance keeps the risk of a corrective pullback firmly on the table.

BTC/USDT 4-Hour Chart: Momentum Slows Near Resistance
Zooming into the 4-hour timeframe, Bitcoin recently broke out of an ascending structure before entering consolidation directly beneath higher-timeframe resistance. While this breakout initially signaled strength, momentum has since begun to slow.
Candles on the 4-hour chart have become noticeably smaller, indicating reduced follow-through from buyers. At the same time, the RSI has rolled over from overbought conditions after forming a bearish divergence. This combination often signals local distribution, particularly when it appears near key resistance zones.
If buyers fail to defend the breakout area between $93,000 and $94,000, a retracement toward the lower boundary of the pattern and potentially the $90,000 region becomes increasingly likely. Such a move would represent a healthy pullback rather than a structural breakdown.
On the other hand, if Bitcoin can hold above the $93,000–$94,000 zone and establish a base, another upside attempt toward the $98,000–$100,000 psychological level becomes realistic. However, buyers will need swift follow-through, as prolonged hesitation increases the risk of a failed breakout.
Key Technical Levels to Watch
| Level | Type | Significance |
|---|---|---|
| $95,000 | Resistance | 100-day moving average & supply zone |
| $93,000–$94,000 | Support | Breakout retest area |
| $90,000 | Support | Range midpoint / trendline confluence |
| $98,000–$100,000 | Resistance | Psychological barrier |
| $106,000 | Resistance | 200-day moving average |
On-Chain Analysis: Supply Continues to Tighten
On-chain data continues to provide a constructive medium-term backdrop. Exchange reserve metrics show that the amount of Bitcoin held on centralized exchanges is trending lower, even as price trades near the top of the local range.
This trend indicates that more BTC is being moved into cold storage or held by long-term participants rather than prepared for immediate sale. Historically, declining exchange balances have been associated with supply tightening, which supports higher prices over time.
Importantly, reduced exchange supply does not eliminate the possibility of short-term corrections. When price presses into technical resistance, pullbacks are still common. However, the on-chain picture suggests that deeper retracements into the $80,000–$90,000 range are more likely to attract buyers rather than trigger full-scale distribution.
Unless a sudden surge of Bitcoin flows back onto exchanges occurs, on-chain data continues to lean bullish on a medium-term horizon, even if near-term volatility remains elevated.
Breakout vs Pullback: Scenario Analysis
At this stage, Bitcoin sits at a technical crossroads. A clean breakout above $95,000 with strong volume could confirm buyer control and open the door for a rally toward $106,000. Such a move would likely shift broader market sentiment firmly bullish.
Alternatively, rejection at resistance followed by a controlled pullback toward $93,000 or even $90,000 would not invalidate the broader structure. Instead, it would allow momentum indicators to reset while maintaining a constructive higher-timeframe setup.
Therefore, patience and confirmation remain key. Both outcomes are technically valid, and market participants should avoid overcommitting before a clear directional signal emerges.
Frequently Asked Questions (FAQs)
Q1: Is Bitcoin currently bullish or bearish?
A1: Structurally, Bitcoin shows medium-term bullish characteristics, but technically it remains at resistance, making short-term direction uncertain.
Q2: What happens if Bitcoin breaks above $95,000?
A2: A confirmed breakout could open the path toward $106,000 and signal a stronger bullish phase.
Q3: Would a pullback be bearish?
A3: Not necessarily. A controlled pullback toward $90,000–$93,000 could be healthy and reset momentum.
Q4: Why is exchange supply important?
A4: Lower exchange balances often indicate reduced selling pressure and stronger long-term holder conviction.
Conclusion
Bitcoin is approaching a decisive moment as price compresses beneath major resistance. While on-chain and structural indicators remain supportive, technical resistance continues to cap upside in the short term. Whether BTC breaks higher or pulls back to reset momentum, the coming sessions are likely to define the next major phase of the market.
Disclaimer
The information provided on Penliberty is for educational and informational purposes only and does not constitute financial advice. Cryptocurrency markets are volatile. Always conduct your own research before making investment decisions. Penliberty is not responsible for any financial losses.